 1.webp)
Why Evolve
L&D Dashboard ?
The user-friendly interface of the Evolve dashboard makes it easy for L&D managers to navigate through various reports and request statuses. The visual representations of data facilitate quick understanding and analysis, enhancing the overall efficiency of the skill gap analysis process.
Training Report: This section displays a pie chart indicating the proficiency levels of employees in training. The chart differentiates between proficiency (in red) and non-proficiency (in teal).
Comparative Performance Analysis: This section shows a pie chart comparing pre-training and post-training performance. The chart highlights the percentage of performance improvement post-training, with 56% of employees improving their performance.
 1.webp)
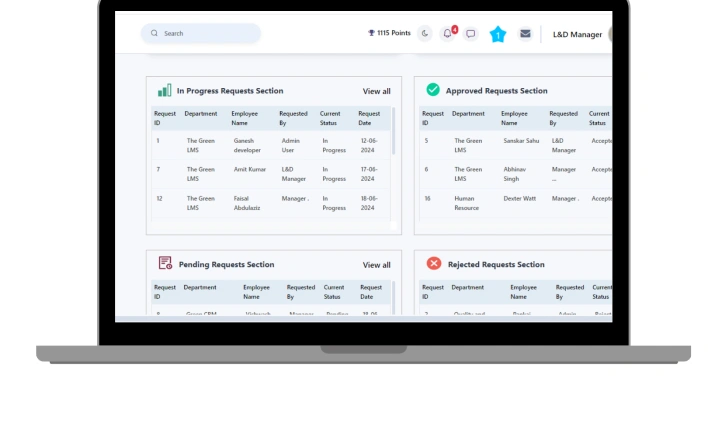
Request Status Sections: These sections categorize and display training requests based on their current status:
- In Progress Requests: Lists ongoing training requests with details such as request ID, department , employee name, requested by, current status, and request date.
- Approved Requests: Displays approved training requests with similar details.
- Pending Requests: Shows pending training requests.
- Rejected Requests: Lists rejected training requests.
 1.webp)
 1.webp)
Describing the Skill Gap Analysis Reporting Feature
Feature Description
The Skill Gap Analysis Reporting feature on Evolve provides comprehensive insights into employee training and performance. It enables Learning and Development (L&D) managers to identify areas where employees need improvement and measure the effectiveness of training programs.
Training Report:
- Proficiency Analysis: The training report includes a visual representation of employee proficiency levels. The pie chart quickly shows the proportion of proficient and non-proficient employees, helping L&D managers identify skill gaps. Comparative Performance Analysis:
- Pre-Training vs. Post-Training Performance: This section offers a comparative analysis of employee performance before and after training. The pie chart clearly illustrates the improvement in performance, with percentages indicating the success rate of the training programs.
Request Status Monitoring:
- In Progress, Approved, Pending, and Rejected Requests: These sections provide a detailed overview of the status of training requests. L&D manager can track the progress of each request, ensuring timely and efficientmanagement of training programs

Frequently asked questions.
Whats happening around the World.
- Training program participation rates
- Course completion statistics
- Employee skill development progress
- Assessment scores
- Certification status
- Learning path completion
- Engagement metrics
- ROI of L&D programs
